Breathe easy: How an air quality forecast comes together
 A stock photo of Calgary's skyline. (Getty Images)
Last August, I agonized about whether or not my twins would get their second birthday party at Calaway Park, or if it would be an indoor day.
On this particular morning, the Air Quality Health Index sat at a two. That's good. Ideal air quality for outdoor activities. The remainder of the day, however, told a different story; the expectation that afternoon was a seven. That's high-risk, where vulnerable populations (such as fresh two-year-olds) are advised to stay indoors.
I checked the forecast: Environment and Climate Change Canada has the Firework model, and BlueSky Canada has the FireSmoke model. One showed smoke rolling through that day; the other showed it passing nearby. What's a forecaster to do?
This story has a happy ending – we went. It remained overcast, some of which was indeed smoke. We did not, however, have any haze on our parade. The entire day went just as well. We played outside when we got home. The smoke never reached the surface, and our air quality never fell to a seven.
So what happened?
"[The Air Quality Health Index] AQHI measures acute risk of bad health outcomes – it's based on a three-hour exposure period.," explained Paul Makar, a senior research scientist with Environment Canada and Climate Change's air quality modeling and integration unit.
"So over a full day, scientists will have eight AQHI values to work with."
Makar says that it's not catastrophizing; it's taking the available information, submitting it to forecasters, and allowing them to make the most educated guess at their disposal. "What we're trying to do in this case is say 'given what we've got, how bad can it possibly get?'"
There are three components which can change our AQHI value:
- Ground-level Ozone (O3) is mostly specific to the summer months. It's the driver of smog.
- Nitrogen Dioxide (NO2) is released by vehicle emissions and fossil fuel power plants and can be held to the surface in certain conditions within the planetary boundary layer (where we live).
- PM2.5 is a mixture of vehicle emissions, industrial facilities, or natural sources, like wildfire smoke. It stands for Particulate Matter of 2.5 microns (μm) or less. The chart below offers comparisons.
 How big is 1 micrometer? (image courtesy: ZEISS Microscopy from Germany - How big is 1 micrometer?, CC BY-SA 2.0)
Putting a forecast together for smoke requires a large team of spectacular scientists. The volume of variables they're working with to make sense of smoke is staggering. I couldn't imagine the length of this formula that applies every imaginable condition to the model, nor the computing strength needed to turn it into a national forecast.
Jack Chen filled me in! He's a modeling scientist, part of the 34-person team tackling Environment and Climate Change Canada's smoke forecast operation.
"We are very good at it now, but what we have now is a state of science that gives us good numerical guidance for our air quality forecasters," explained Chen.
Smoke forecasting is another level of weather forecasting; the movement of air affects the position of the smoke and, according to Chen, there are "a whole lot of complex dispersion chemistry problems that need to be resolved to give us what we have now."
And that's just the atmosphere; the ground matters too! Different areas burn better. It's good they have help,
"We're seeing a long-term collaboration between Environment Canada, Canadian Forest Service, [and] measurement communities in the (United) States," said Chen."This is all driven from fundamental science, and in close collaboration over years in putting all this together.
"In order to get this stuff out in the forecast in enough time to be useful, we have to run it through one of the biggest supercomputers in the country."
A massive supercomputer amalgamates this information, applies it, and it can spit out a national forecast for Environment and Climate Change Canada's local meteorologists – and the public – to view and assess.
THE STATE OF THE SCIENCE – PAST, PRESENT AND FUTURE
No forecast model ever gets it right 100 per cent of the time. This is science, math and computer engineering melded together. That can make for imperfections – it's a lot of moving parts. If there's an error on day one of a forecast, that can easily compound into further errors for days two and three. Paring it back to run-of-the-mill (or not!) weather, here's a pair of tweets from the big snowfall event of this April:
That day, we had over 30 centimetres of snow near the airport (thank you, Rolf!), while a station in Okotoks participating in CoCoRaHS (the Community Collaborative Rain, Hail & Snow Network) declared a meagre 2.5 centimetres.
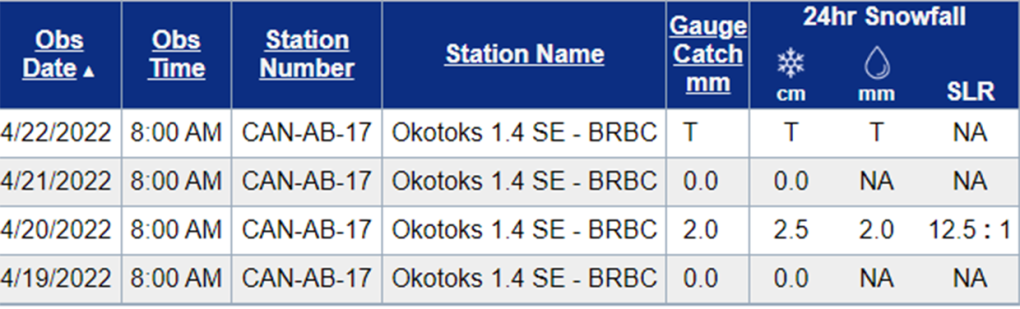 CoCoRaHS chart of snow accumulation in Okotoks, Alta. for specific days in April 2022.
In this instance, forecast models declared between two and 17 centimetres. It falls on scientists to make educated guesses, based on both available data and similar past events. Snow – and snowfall warnings, as was the case with this event in Calgary – are certainly something to take seriously. While smoke or air quality advisories lack the same impact on a commute, they, too, deserve healthy measure of respect.
So much so, that the scientific community has seen a funding increase in this regard.
"There are a lot of different agencies that are now realising the importance of all this," said Christopher Rodell, a PhD student in atmospheric sciences at UBC who also works with BlueSky Canada, which is a collaboration of forest fire information between Alberta and British Columbia. "There's a fair amount of funding that's coming into the system or the sciences now, which is really helpful for the model development work. Things are definitely evolving quite rapidly in that space."
BlueSky Canada also runs the FireSmoke model.
Development of FireSmoke began around 2013 and went online in 2016; from a scientific perspective, that’s relatively new. Advancements are in the works with the funding increase.
"We've got a couple of proposals now, one's called Inferno – we want to fly an instrumented aircraft into downwind forest fire smoke plumes… [And] we're using satellite data to estimate emissions and heights, the forest fire plumes in Canada and around the world,” explained Paul Makar.
Makar says it's more about collaboration than competition between organizations. Multiple research teams, along with a substantial number of grant recipient universities in the United States, continue to push this field forward.
They have to. Here's a look at a report from 2019, cataloguing the worst wildfire seasons in B.C. dating back to 1950:

This is not the sort of trend we want to be in, and yet, here we are: ClimateData.ca launched in 2019, to model the effects of climate change. Here's a peek at Calgary, for the curious.
The takeaway: wildfire frequency and intensity stand to increase in the future. "Bearing in mind that [Jack Chen and I] are climate modellers, the scientific consensus is that climate change will result in hotter conditions in the future… What causes fires? Drought, decreased snowfall, decreased rainfall. Those are conditions that will lead to forest fires... generating the large fires in particular, larger fires."
Shopping Trends
The Shopping Trends team is independent of the journalists at CTV News. We may earn a commission when you use our links to shop. Read about us.


CTVNews.ca Top Stories

NEW
NEW Federal Liberals to pick new leader on March 9 as rules for leadership race are defined
The Liberal Party of Canada have announced leadership race rules late Thursday, including a significant increase in entrance fees and a requirement for voters to be Canadian citizens.
Liberals will remove 'fraudulent' memberships, as some register their pets to vote
A federal Liberal spokesman says the party can and will remove "fraudulent profiles" from its list of electors eligible to vote for its next leader.
NEW
NEW Why four Canadians traded their traditional office space for a life on the road
CTVNews.ca asked Canadians who've embraced the digital nomad lifestyle, or have done so in the past, to share their stories — the challenges, triumphs and everything in between.
New L.A.-area fire prompts more evacuations while over 10,000 structures lost to the 2 biggest blazes
The two biggest wildfires ravaging the Los Angeles area have burned at least 10,000 homes, buildings and other structures, officials said Thursday as they urged more people to heed evacuation orders after a new blaze ignited and quickly grew.
Is the Hollywood sign on fire?
As fires scorch Los Angeles, fake images and videos of a burning Hollywood sign have circulated on social media.
NEW
NEW Five ways homeowners can protect themselves from contractor fraud
Building or renovating a home can be one of the biggest expenses of one's life. It's costly, and potentially even more expensive if something goes wrong. Between 2022-24, the Better Business Bureau (BBB) received hundreds of complaints about general contractors in Canada.
How to improve climate predictions? McGill researchers turn to 19th century letters
A team led by McGill University researchers came up with a method they hope could improve climate models over Africa by combining them with 19th century missionary records, refashioning dubious documents in a bid to better inform projections of global warming's impact.
Ex-Trump adviser says Canada in 'difficult position' amid tariff threat, Trudeau resignation
In the face of a potential tariff war, U.S. president-elect Donald Trump's former national security adviser John Bolton says 'Canada is in a difficult position' in part due to Prime Minister Justin Trudeau's resignation and a looming general election.
Canadian travellers now require an ETA to enter U.K. Here's what to know
Starting Jan. 8, Canadians visiting the U.K. for short trips will need to secure an Electronic Travel Authorization (ETA) before boarding their flight, according to regulations set out by the U.K. government.
Edmonton
-

'Elaborate' solar-powered encampment found in Fulton Creek
Edmonton police have dismantled two large encampments in the Fulton Creek area, including one with electricity.
-
Penguins run up score early in win over visiting Oilers
Sidney Crosby had a goal and two assists to move into ninth on the NHL's career scoring list as the Pittsburgh Penguins beat Connor McDavid and the Edmonton Oilers 5-3 on Thursday night.
-
Five hurt in Red Deer industrial fire
Five people are in hospital following an explosion Thursday at a Red Deer industrial site.
Lethbridge
-

Lethbridge police seek help locating suspect in Wednesday night robbery
Lethbridge police are seeking public assistance to locate a suspect in releation to a robbery.
-
Southern Alberta woman sentenced to house arrest, curfew for fatal collision
A southern Alberta woman has been sentenced for a fatal collision that claimed the life of a 26-year-old Okotoks man in 2023.
-
2 people charged after multiple break-and-enters of Nanton businesses
A Nanton resident and a Claresholm resident have been charged in relation to multiple break-and-enters that took place in southeast Nanton.
Vancouver
-

'They don't realize it's not marriage. It's slavery': What a B.C. man is doing to free Cambodians trapped by traffickers
Brian McConaghy began his work in Cambodia decades ago, helping the RCMP on investigations to jail to sex predators from B.C. abusing children overseas. Later, his organization, supported by Canadians, built a secure centre in Phnom Penh, where they protect and support those who have been trafficked internationally.
-
'It's pretty wild out there': Canadian living in L.A. describes life near wildfires
The constant smell of smoke is a reminder all over Los Angeles, even in neighbourhoods far from the flames, that the fight against wildfires isn’t over.
-
Calls to improve B.C. building codes as fires rage in California
As fires continue raging in California, there are calls here in B.C. to improve building codes to make structures more resistant to wildfire.
Vancouver Island
-
'They don't realize it's not marriage. It's slavery': What a B.C. man is doing to free Cambodians trapped by traffickers
Brian McConaghy began his work in Cambodia decades ago, helping the RCMP on investigations to jail to sex predators from B.C. abusing children overseas. Later, his organization, supported by Canadians, built a secure centre in Phnom Penh, where they protect and support those who have been trafficked internationally.
-
'It's pretty wild out there': Canadian living in L.A. describes life near wildfires
The constant smell of smoke is a reminder all over Los Angeles, even in neighbourhoods far from the flames, that the fight against wildfires isn’t over.
-
Calls to improve B.C. building codes as fires rage in California
As fires continue raging in California, there are calls here in B.C. to improve building codes to make structures more resistant to wildfire.
Saskatoon
-

'It feels good': First 28 students from University of Saskatchewan's nursing fast-track program graduate
The first students of a fast-track nursing program at the University of Saskatchewan have graduated. The program aims to address the province's healthcare staffing shortage.
-
Saskatoon restauranteur George Kosmas looks back on a life spent in The Cave
For nearly his entire life, George Kosmas can remember spending days and nights at The Cave.
-
'They are hopeless': Saskatoon family desperate to bring sisters to Canada
Two Saskatoon women are desperately trying to get their loved ones out of Afghanistan, as the Taliban continues to oppress women.
Regina
-

Above average home sales on 18-month streak in Sask.
According to the Saskatchewan Realtors Association, 2024 was the second-best year on record in terms of home sales in the province.
-
Regina man previously wanted on Canada's Most Wanted list makes first court appearance
Twenty-two-year-old Reshuan Norman Cote stood in the prisoner’s box as he made his very first court appearance for his involvement in a homicide last year.
-
Sask. taxidermy business fined more than $7,000, 144 'wildlife exhibits' seized
What began as a "straightforward" inspection of a Saskatchewan taxidermy business quickly became a complex investigation – ultimately leading to more than $7,000 in fines.
Toronto
-
NEW
NEW Federal Liberals to pick new leader on March 9 as rules for leadership race are defined
The Liberal Party of Canada have announced leadership race rules late Thursday, including a significant increase in entrance fees and a requirement for voters to be Canadian citizens.
-
Ontario homeowners left with expensive contracts after company appears to go out of business
Several homeowners in Ontario signed contracts with Provincial Smart Home Services promising rebates for their energy efficient upgrades, but now won't receive them as the company appears to have gone out of business.
-
‘Mama is waiting for you’: Woman appeals for return of 3-year-old son after ex-husband failed to bring him back to Canada
The mother of a three-year-old Toronto boy is urging her former husband who is wanted in a parental abduction investigation to bring their son back to Canada from India.
Montreal
-
NEW
NEW Federal Liberals to pick new leader on March 9 as rules for leadership race are defined
The Liberal Party of Canada have announced leadership race rules late Thursday, including a significant increase in entrance fees and a requirement for voters to be Canadian citizens.
-
How to improve climate predictions? McGill researchers turn to 19th century letters
A team led by McGill University researchers came up with a method they hope could improve climate models over Africa by combining them with 19th century missionary records, refashioning dubious documents in a bid to better inform projections of global warming's impact.
-
Côte Saint-Luc tenants currently living without adequate heating and hot water
Residents of an apartment building in Côte Saint-Luc say they are currently living without adequate heating and hot water in the midst of winter.
Atlantic
-

Suspicious death of woman in Bible Hill ruled a homicide: N.S. RCMP
The RCMP is treating the suspicious death of a woman in Bible Hill, N.S., last week as a homicide.
-
Maritimers flee L.A. homes as fires continue to rage
Several Maritimers have fled their homes in Los Angeles amid the historic fires.
-
NEW
NEW Federal Liberals to pick new leader on March 9 as rules for leadership race are defined
The Liberal Party of Canada have announced leadership race rules late Thursday, including a significant increase in entrance fees and a requirement for voters to be Canadian citizens.
Winnipeg
-

Another big tax hike is potentially coming for Brandon residents
Brandon homeowners are facing the possibility of a double-digit tax increase in 2025.
-
Winnipeg man charged with sexually assaulting children at daycare: police
Police have charged a man with sexually assaulting two children at an unlicensed daycare in Winnipeg.
-
'A policing trailblazer': Tributes pour in for MFNPS chief believed to have died in house fire
The remains of Manitoba First Nations Police Service’s (MFNPS) leader are believed to have been found following a fire at his home.
Ottawa
-
 NEW THIS MORNING
NEW THIS MORNING What's happening in Ottawa this weekend: Jan 10-12
The green flag flies on the Rideau Canal Skateway, the Ottawa 67's, Charge and Senators play on home ice and two comedians take the stage at the Canadian Tire Centre. CTVNewsOttawa.ca looks at things to do in Ottawa and eastern Ontario this weekend.
-
Sunny and cold start to the weekend in Ottawa
The cold temperatures will continue in Ottawa through the weekend and into next week, which is good news for people hoping to skate on the Rideau Canal Skateway.
-
'It's really horrific': Former Ottawa residents in LA evacuated due to fires
Feeling the power of the Santa Ana winds and seeing the massive plumes of smoke off her deck in Topanga Canyon earlier this week, Catherine McClenahan knew it was time to go.
Northern Ontario
-

Alta. man charged and released twice in one night for violence at northern Ont. hotel
Last weekend, an Alberta man was arrested and released for intimate partner violence at a northern Ontario hotel just hours after being charged and released for assaulting a teen with a weapon at the same location.
-
Former Sudbury, Ont., police officer found guilty of 2007 sexual assault
Wayne Foster, a former police officer with the Greater Sudbury Police Service, has been found guilty of sexual assault in connection with an incident Aug. 24, 2007.
-
Superbug outbreak declared at Sault Area Hospital
An outbreak has been declared in a medical unit at the Sault Area Hospital due to a superbug.
Barrie
-
Fatal cyclist crash in Thornbury
A serious collision between a vehicle and cyclist was investigated in Thornbury.
-
RVH faces surge in patients amid flu season strain with ER wait times exceeding 8 hours
Royal Victoria Regional Health Centre in Barrie is dealing with unprecedented patient volumes, with occupancy levels far exceeding capacity.
-
Snow squalls blanket Clearview Township, keeping crews and residents busy
Unrelenting snow squalls kept residents and road crews in Clearview Township on their toes Thursday, including one CTV News reporter.
Kitchener
-
NEW
NEW Federal Liberals to pick new leader on March 9 as rules for leadership race are defined
The Liberal Party of Canada have announced leadership race rules late Thursday, including a significant increase in entrance fees and a requirement for voters to be Canadian citizens.
-
More than 150 students sick at University of Guelph, says public health
More than 150 cases of gastroenteritis have been reported at the University of Guelph.
-
Ontario family describes 'horrific' experience after being stuck in limbo due to delayed WestJet flight
A family trip to Costa Rica quickly turned into a nightmare for an Ontario family, after their WestJet flight to Canada was delayed.
London
-
Fatal cyclist crash in Thornbury
A serious collision between a vehicle and cyclist was investigated in Thornbury.
-
More snow coming Friday with cold temperatures expected
A low-pressure system is moving through a cold front, bringing with it some snow Friday afternoon.
-
Rivals Windsor Spitfires and London Knights set to face off Friday
The Windsor Spitfires and London Knights will go head-to-head on Friday, as the Knights host the Spits.
Windsor
-

Sentencing date set for Windsor man convicted of careless driving in fatal Retrofest collision
A sentencing date has been set for a Windsor man convicted of careless driving in a fatal Retrofest collision.
-
Rivals Windsor Spitfires and London Knights set to face off Friday
The Windsor Spitfires and London Knights will go head-to-head on Friday, as the Knights host the Spits.
-
Teen charged with assault after allegedly spraying bear mace
An 18-year-old man has been charged with assault after he allegedly bear maced someone during an argument in east Windsor.